
Breakouts
Keltner Channel Breakout
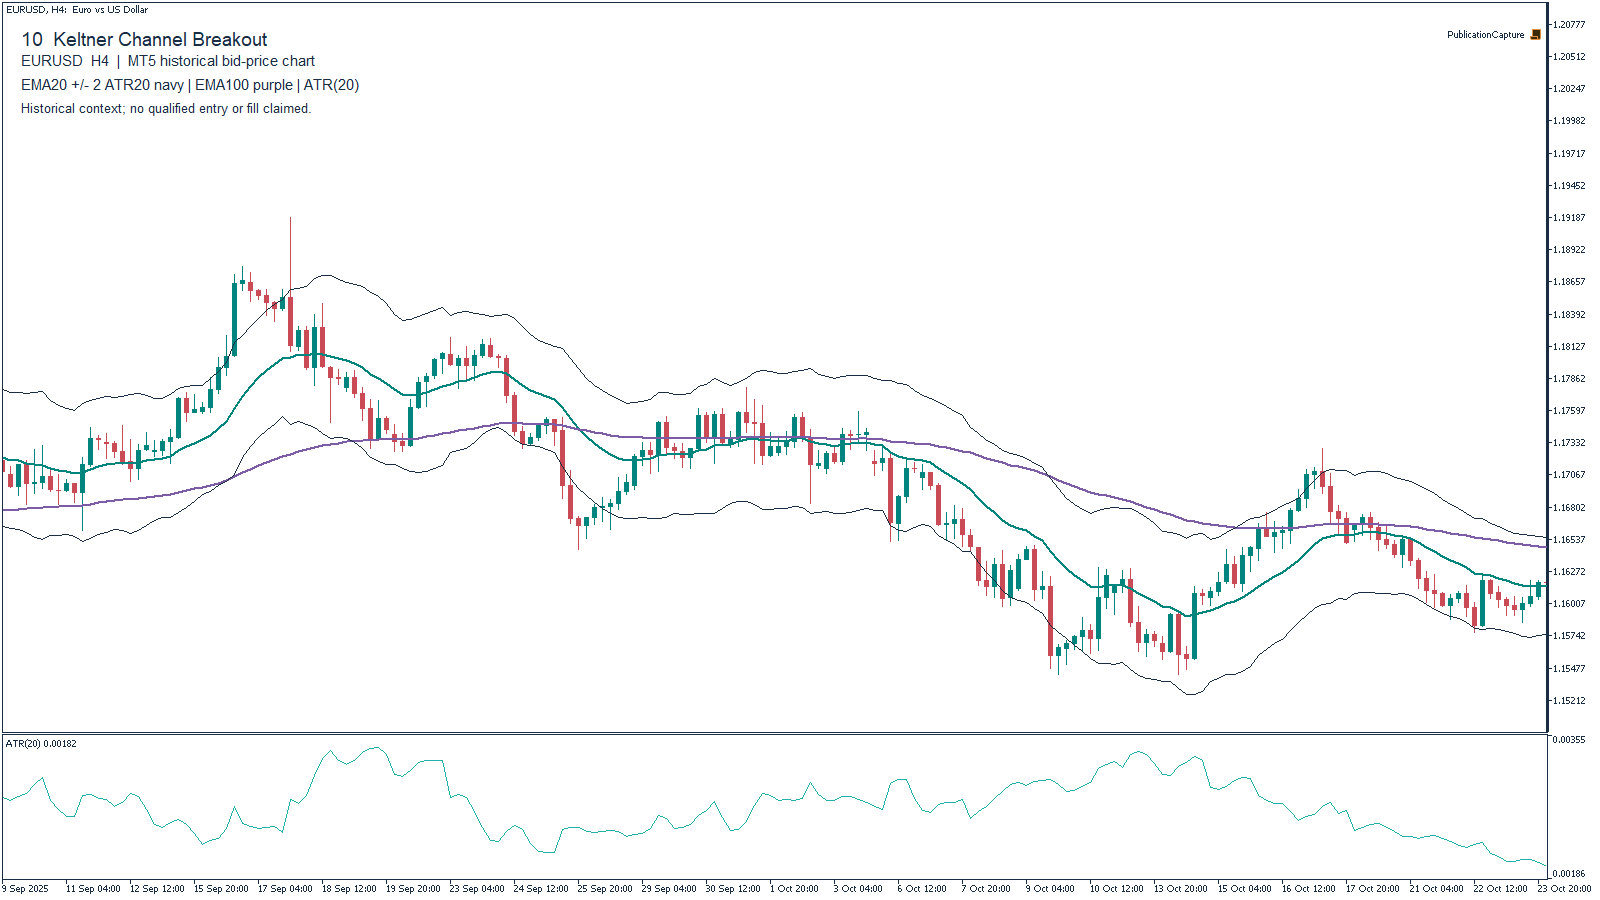
A volatility-adjusted channel breakout whose channel is an editorial definition: EMA(20) plus or minus twice ATR(20).
- Category
- Breakouts
- Timeframes
- H4
- Pairs
- EURUSD, GBPUSD, AUDUSD, USDCAD
- Test status
- Mechanical bar tests completed; profitability unverified
How the rule works
An ATR-based channel adapts its width to recent ranges. A first completed close outside the channel is a volatility-expansion hypothesis in the EMA100 direction. Repeated outside closes are deliberately not counted as new breakouts. Reversions through EMA20 can be frequent when prices oscillate around a flat trend filter.
Setup
- Use EMA20(Close) ± 2 × MT5 ATR20 for channel bands; EMA100(Close) is the trend filter. Long signal requires Close[1] > upper[1] and EMA100[1], with Close[2] <= upper[2]. Short requires Close[1] < lower[1] and EMA100[1], with Close[2] >= lower[2].
- This is the modern EMA/ATR channel definition. It differs from Chester Keltner’s original typical-price/average-range construction. One position per symbol.
Indicators
- EMA(20)
- ATR(20)
- Keltner multiplier 2
- EMA(100)
Long entry
- Buy at next-bar ask after the confirmed upper-band close. Do not take an intrabar band touch because it may disappear by close.
Short entry
- Sell at next-bar bid after a confirmed lower-band close while close is below EMA(100).
Stop loss
- Initial stop is the EMA(20) at signal close or 2×ATR(20) from entry, whichever produces the smaller loss distance only if it lies on the correct side; otherwise use 2×ATR.
Exit
- Exit a long after a completed close below EMA20, or a short after a close above EMA20, at the next executable quote. Time exit: 18 completed H4 bars.
- Optionality is removed from this specification: also maintain a 3×ATR20 chandelier stop. Long uses highest completed high since entry minus 3×current ATR; short uses lowest completed low plus 3×ATR. Tighten only after a close.
Risk and position size
- Risk 0.50% equity. Skip signals where spread exceeds 10% of stop distance, because trading costs dominate a narrow channel trade.
Costs and execution
- Keltner implementations differ in ATR versus average-range choice. State this formula in code, use finished H4 data, log executable spread/slippage, and account for rollover swap.
When the method can fail
- Avoid low-volatility compressions immediately ahead of event risk and repeated outer-band closes without follow-through. Breakouts can fail back through the average.
Worked example
- Hypothetical channel: EMA20 is 1.1000 and ATR20 0.0020, making the upper band 1.1040. A close of 1.1045 qualifies only if the preceding close was not above its own upper band and price is above EMA100. With entry 1.1047, the nearer valid 2×ATR stop is 1.1007.
Historical test results
No tested pair meets the complete research-screen criterion. Positive cells alone do not qualify the strategy.
24 mechanical runs across 4 pairs on H4. Decisions use completed strategy bars; fills use native ICMarketsEU-Demo M15 Bid candles with explicitly modelled costs. Full window: 1 January 2025–18 September 2026. Shorter available histories: USDCAD: 2025-03-13. Each row starts with an independent USD10,000 account.
| Pair | Period | Costs | Trades | Net return | Profit factor | Max drawdown | Ambiguous bars |
|---|---|---|---|---|---|---|---|
| EURUSD | combined | base | 67 | -4.48% | 0.7204 | 7.29% | 0 |
| EURUSD | combined | stress | 67 | -5.63% | 0.6567 | 8.18% | 0 |
| GBPUSD | combined | base | 67 | -0.57% | 0.957 | 5.96% | 0 |
| GBPUSD | combined | stress | 67 | -2.54% | 0.8205 | 6.71% | 0 |
| AUDUSD | combined | base | 62 | -8.59% | 0.4594 | 9.73% | 0 |
| AUDUSD | combined | stress | 62 | -9.94% | 0.3992 | 11.02% | 0 |
| USDCAD (shorter coverage) | combined | base | 63 | -0.16% | 0.9865 | 3.90% | 0 |
| USDCAD (shorter coverage) | combined | stress | 63 | -2.89% | 0.7748 | 4.89% | 0 |
Show 2025 and 2026 separately
| Pair | Period | Costs | Trades | Net return | Profit factor | Max drawdown | Ambiguous bars |
|---|---|---|---|---|---|---|---|
| EURUSD | 2025 | base | 43 | -5.15% | 0.5464 | 5.66% | 0 |
| EURUSD | 2025 | stress | 43 | -5.79% | 0.5026 | 6.16% | 0 |
| EURUSD | 2026 | base | 24 | +0.67% | 1.1338 | 3.67% | 0 |
| EURUSD | 2026 | stress | 24 | +0.05% | 1.0099 | 3.98% | 0 |
| GBPUSD | 2025 | base | 40 | +1.18% | 1.1517 | 3.74% | 0 |
| GBPUSD | 2025 | stress | 40 | -0.14% | 0.9834 | 3.96% | 0 |
| GBPUSD | 2026 | base | 27 | -1.77% | 0.6779 | 3.69% | 0 |
| GBPUSD | 2026 | stress | 27 | -2.40% | 0.5763 | 4.19% | 0 |
| AUDUSD | 2025 | base | 40 | -8.32% | 0.282 | 9.60% | 0 |
| AUDUSD | 2025 | stress | 40 | -9.14% | 0.2407 | 10.29% | 0 |
| AUDUSD | 2026 | base | 22 | -0.31% | 0.9343 | 4.70% | 0 |
| AUDUSD | 2026 | stress | 22 | -0.95% | 0.8088 | 5.15% | 0 |
| USDCAD (shorter coverage) | 2025 | base | 29 | -0.17% | 0.9643 | 2.62% | 0 |
| USDCAD (shorter coverage) | 2025 | stress | 29 | -1.60% | 0.7115 | 3.34% | 0 |
| USDCAD | 2026 | base | 34 | -0.00% | 0.9996 | 3.90% | 0 |
| USDCAD | 2026 | stress | 34 | -1.40% | 0.8114 | 4.93% | 0 |
Costs, execution and qualification criteria
Base: Spread 1.0 pip for majors; 1.5 EURGBP/EURJPY; 2.0 GBPJPY/AUDNZD. USD7/100k round-trip commission; 0.1 pip adverse market/stop slippage per fill. Financing=max(negative current native swap,0.2pip/night), no positive credit, native triple-swap day.
Stress: Double base spread; 0.3 pip adverse slippage/fill; same commission; double max(negative current native swap,0.5pip/night).
Research candidate only if a pair has >=30 trades in EACH calendar subperiod, positive net returns and PF >=1.10 in EACH subperiod under BOTH cost scenarios, and combined maximum drawdown <=15% under BOTH scenarios. Not a statistical profitability proof. All pairs and failures are retained.
Profit factor is the sum of positive net trade results divided by the absolute sum of negative results. Drawdown includes adverse M15 intrabar marks. The end of each test window liquidates open positions, so separate subperiod returns do not add exactly to the continuous-window return.
- Bar execution, not a real-tick MT5 Strategy Tester run. Same-bar ambiguity is treated adversely and counted.
- Current swap snapshot is an explicit stress assumption, not historical funding.
- One isolated USD10,000 account per strategy/pair, leverage ceiling30, broker minimum lots and steps. Results cannot be added into one portfolio.
- 2026 is a later evaluation slice, not untouched independent out-of-sample evidence; no parameter optimization was performed.
- Retrospective scheduled MT5 calendar may contain revised release times. UTC export normalized to NY-close broker clock against BLS releases.
- General discretionary event avoidance is fixed as high-impact events for either currency +/-30min. IDs1/17 next60min; ID20 next120min. ID13 UK bank holidays excluded. Subjective trend quality, unscheduled events and all-country holiday/session quality are not fully quantifiable; these are documented mechanical variants.
- Sparse broker histories are reported with shorter effective coverage and are ineligible for a candidate label.
- Native indicator parity: ATR, SMA, RSI, MACD, bands, stochastic, WPR, CCI and Ichimoku matched native buffers on EURUSD H4 within rounding tolerance; Wilder ADX matched the MetaQuotes ADXW example. EMA200 seed residual at 1,000 bars was 0.000000715, falling below 0.0000000001 after 2,000 bars.
- Built-in iSAR differs from the published MetaQuotes example on reversal bars. ID9 therefore uses actual built-in iSAR buffers exported by MT5, joined by timestamp, not the approximate Python SAR. Native GBPUSD/USDJPY SAR history needs 300 warm-up bars from January 2025, so those rows start later and cannot pass the full-period screen.
- 37 automated checks passed: execution gaps, short ask prices, ambiguous stop/target candles, partial commissions, pending expiry, time zones, rule regression cases and monthly portfolio no-lookahead/cash costs.
Interpretation: these are mechanical bar-model tests, not verified real-tick or live performance. Price rules were held fixed; subjective market-quality exclusions remain outside the mechanical model. Strategy adaptation requires a new test.
Download all test metrics and assumptions (JSON) · Download simulated trade logs and reproducible research code · Broker commission and swap documentation
Execution conventions
- Bar [0] is forming; [1] is the most recently completed bar. Unless explicitly stated otherwise, indicators use Close with zero plot shift and signals use completed bars. EMA is exponential, SMA is arithmetic and MT5 ATR is its native true-range average. Use at least 300 completed warm-up bars; a longer rule-specific requirement takes priority.
- A close-based signal is executed at the first available quote after the close, never retrospectively at the signal close. Buy at ask, sell at bid; close longs at bid and shorts at ask. A standing stop or target can fill within a bar. A gap through a stop fills at the first executable price, which can be worse than the stop.
- R means the initial entry-to-protective-stop distance, fixed at entry. Convert that distance into account-currency loss using the symbol tick size and loss-side tick value. Lots = cash risk / loss per lot, rounded down to the broker volume step. Round prices to the trade tick and recheck risk plus minimum stop/freeze distances before submitting. Budget commission and slippage separately; skip if minimum size exceeds the risk limit.
- Use one position per symbol and no averaging down. A trailing stop only tightens after a completed bar and becomes active on the next quote. The entry bar is holding bar one; a time exit executes on the quote after the specified holding bar closes. When a hard stop and a close-based exit compete, the stop already active takes precedence. With OHLC-only data, assume stop before target if both can occur in one bar; tick data is needed to resolve the order.
- The article defines the price rule. Any discretionary news exclusion changes the tested variant and must be recorded in advance. Map broker timestamps to the named London/New York time zone using historical daylight-saving offsets; do not assume a fixed UTC offset. Include spread, commission, slippage, overnight financing and triple-swap days in a profitability test.
Adapt and test your version
- Treat these inputs as a reproducible starting specification. Choose a currency pair, session and holding period that match the time you can monitor the market, then record any changes to indicator periods, thresholds, stop distance or exits as a new version.
- Change one hypothesis at a time. Reserve a later period and additional pairs for evaluation before looking at their results. Include your account’s actual trading and financing costs, compare small parameter changes, and forward-test on demo. A selected profitable window does not validate the strategy or its modified version.
Reproduce the chart in MT5
- Open EURUSD on H4. Add the indicators listed above through Insert → Indicators; use Close and zero shift unless a different setting is specified. The Data Window displays exact values for the selected completed candle.
- Compare the signal candle with the required earlier bars before moving forward. Use the crosshair to read prices and times. For custom channels, session levels or Supertrend, reproduce the formula in this guide and check the calculation before relying on an external indicator.
- Draw entry, initial SL and target only after a candle has satisfied every condition. Label planned levels as plans; they do not demonstrate a historical fill. The featured chart is genuine historical MT5 context and is not a trade-performance report.
Sources
- MT5 Help: Average True Range — Indicator/platform definition; not strategy performance.
- StockCharts: Keltner Channel Parameters — EMA/ATR channel construction. This guide uses ATR20 rather than the documented ATR10 default.
MT5 Expert Advisor and test status — version 1.01
Keltner Channel Breakout: TF_Strategy_10.ex5, H4. This single-symbol implementation uses the core entry and exit rules above with the execution conditions below. The ZIP includes the compiled EA, complete local source headers, input documentation, tester defaults and the historical calendar.
Download Strategy 10 EA v1.01 (ZIP) · Read the versioned test data
How this EA executes
Signals use completed H4 bars. Execution waits for an open MT5 trading session and uses the available bid/ask quote. The common entry spread ceiling is 3.0 pips, with any additional strategy-specific spread checks retained. A new position is blocked when another position already exists on the same symbol. The full input table and timing exceptions are included in the ZIP.
The historical calendar blocks entries outside its declared coverage. Within coverage, a missing individual event cannot be detected. Relevant high-impact events block entries 30 minutes before through 30 minutes after.
The default clock follows the New York-close broker schedule (UTC+2 in US winter, UTC+3 in US summer). Set UTC or a fixed offset for a different feed. The fallback Sunday hour is ambiguous; the source audit found no observed M1 records in that hour for the seven majors across the ten checked years. This is not a universal broker-clock guarantee.
What has actually been tested
Functional validation; long-term profitability is not established. Research case id10-eurusd-202402-release101 used EURUSD real bid/ask ticks from 2024-02-01 to 2024-03-01 (end exclusive), starting at USD 10,000. Earlier history supplied warmup only; declared warmup gaps limit the interpretation.
| Positions / partial exits / tester-end closes | 2 / 0 / 0 |
|---|---|
| Price P/L | USD -19.37 |
| Native booked swap (not verified historical funding) | USD -3.45 |
| Additional modeled commission | USD 1.33 |
| Net cash result | USD -24.15 |
The pilot was negative: price P/L plus native booked swap, less USD 3.50 per lot per side of modeled commission, produced the net result above. Observed bid/ask spread is included; no extra execution delay was added. The sample does not establish a persistent edge or prove why returns would recur. Historical swap rates, slippage and complete independent signal/indicator replay remain unvalidated. Tester-end closes, where listed, are not strategy exit signals.
The exact downloadable production EX5 also completed a separate native test (2024-02-01 to 2024-03-01, end exclusive): 2 positions, 0 partial exits and 0 tester-end closes. Its native ledger was reconciled. This run had no extra research commission, so its cash result is not the after-cost benchmark above.
Install and reproduce
- Copy the ZIP’s MQL5/Experts/TradeForex/TF_10/ directory into the terminal data folder, and TF-calendar.csv into MQL5/Files/.
- Choose this EA in Strategy Tester on H4, load the included preset through Inputs → Load, and use every tick based on real ticks with the documented symbol clock and calendar coverage.
- Review costs, session metadata and per-order risk for the intended instrument. The research cost overlay is described in TEST-STATUS.json; a normal MT5 report does not automatically reproduce it.
Account trading defaults to disabled; real accounts are rejected by this build. The validations above used Strategy Tester only. Article-level portfolio limits are not automatically enforced across symbols.
Multi-year EURUSD benchmark — EA 10 v1.01
Keltner Channel Breakout · H4. All 20 planned base/stress cases completed and reconciled. The research binary uses the version 1.01 strategy with the documented tester cost overlay.
EURUSD only, using genuine historical bid/ask ticks in MT5’s real-tick mode. Ten independently started segments span selected dates from 2 July 2018 to 18 September 2026 (end exclusive). Excluded broker-calendar dates and short residual windows are listed in the downloadable benchmark data. Broker time is UTC+2 in US winter and UTC+3 in US summer; source ticks are UTC. Earlier history supplies warmup only, with at least 400 observed completed bars required at the first decision; warmup gaps remain a limitation. The full ten-year data archive is not a ten-year continuous performance test.
Each segment starts flat at USD 10,000. Base uses USD 3.50 per lot per side and no added execution delay. Stress uses USD 7.00 per lot per side plus a 200 ms delay. Observed spread is included in price P/L. Stress changes both commission and delay, so its difference from base does not isolate either effect. Remaining positions are closed and charged at each segment end.
Results below sum independent segment cash outcomes; they are not a compounded account return. Drawdown is the worst observed individual segment, not a continuous full-period or intratick worst-case drawdown. It uses observed native equity after modeled fees and native booked swap. Profit factor groups complete positions, including partial exits; n/a means the loss denominator is unavailable. Native booked swap is shown separately and has not been checked against historical financing rates. Native equity can affect subsequent sizing, so subtracting swap does not recreate a separate no-financing simulation.
The rules were fixed before this campaign, but parts of the historical period had already been inspected during development. This is not an untouched out-of-sample test, and no automatic profitability badge is awarded. Ledger reconciliation is not a complete independent replay of every indicator and decision. These figures describe this exact implementation and sample; they do not establish why an apparent edge would persist. Account-level and portfolio controls described elsewhere on this page still apply.
| Measure | Base | Stress |
|---|---|---|
| Positions | 300 | 300 |
| Price P/L (USD) | -421.68 | -422.36 |
| Modeled commission (USD) | 193.34 | 386.54 |
| Net before financing (USD) | -615.02 | -808.90 |
| Native booked swap — unverified (USD) | -199.30 | -199.36 |
| Net including native swap (USD) | -814.32 | -1,008.26 |
| Position profit factor before financing | 0.908 | 0.881 |
| Positive segments before financing (out of 10) | 4 | 4 |
| Worst observed individual segment drawdown (USD) | 553.14 | 572.55 |
| Worst observed individual segment drawdown (%) | 5.46 | 5.65 |
| Forced tester-end closes | 4 | 4 |
| Reviewed server rejections retained | 0 | 0 |
Base: Summed price P/L was non-positive; modeled commission reduced the result further. The sample lost money before financing.
Stress: Summed price P/L was non-positive; modeled commission reduced the result further. The sample lost money before financing.
Download the benchmark figures, exact segment dates and evidence hashes.